Case Study
Sample4Crop model
The case study of the Gilat Center Pivot in Israel provides the user with an example of the application process from data input to output, including data collection, data processing, data analysis and a detailed explanation of the delivered outputs.
The case study is a field trial consisting of a commercial center pivot agricultural field with a rotation of field crops. More information about the field trial can be found here
Overview of case study
The case study is a commercial field located in Gilat Research Center 10 km east from Be’er Sheva (coordinates 31o20’ N; 34o40’ E). The field is a 12.5 ha of field crop (maize – cotton rotation), irrigated with a variable rate irrigation (VRI) center pivot with moving sprinklers in a 200 m radius. The area has a semi-arid Mediterranean climate with mean maximum summer temperature 36.87°C (July and August), mean minimum winter temperature 10.14°C (January), a mean annual precipitation of 220mm (rainfall falling between October – April), and average annual reference evapotranspiration (Penman-Monteith) of 1533 mm. Topography of the field is gently sloping with a range between 150-161 m above sea level. A small seasonal (winter) creek runs through the entire field.
Collected input data
A variety of plant and environmental data was collected using in-situ measurements, data logging (wired and wireless sensors) and UAV (drones) collected data.
Collected data included:
Continuous data collected for the entire field such as, thermal and multispectral imaging with drones, soil properties e.g. apparent electrical conductivity (ECa), meteorological data, topographical data including digital surface and digital elevation models (DSM, DEM) and yield. Crop related indices CWSI and normalized difference vegetation index (NDVI) were derived from the thermal and multispectral images, respectively. The topographic wetness index (TWI) was derived from the DEM.
Only data that was spatially continuous, such as topographical data (slope, aspect, TWI), ECa, NDVI and CWSI, were used to develop/run the model and the tool. All data was organized in a raster format, with each raster representing an attribute (such as slope, NDVI, TWI etc.). All rasters were sampled by using a fishnet method. For each sample location the x,y coordinates were derived as well. The final output dataset includeds a CSV file where each column represented a variable.


Analysis
Data was analyzed using machine learning methods and spatial statistical methods in order to recognize spatial patterns and correlations among variables and examine which variables most affect the response variable (the variable to be sampled). Based on the analysis a multivariate spatial sampling model was developed.
Results and output data
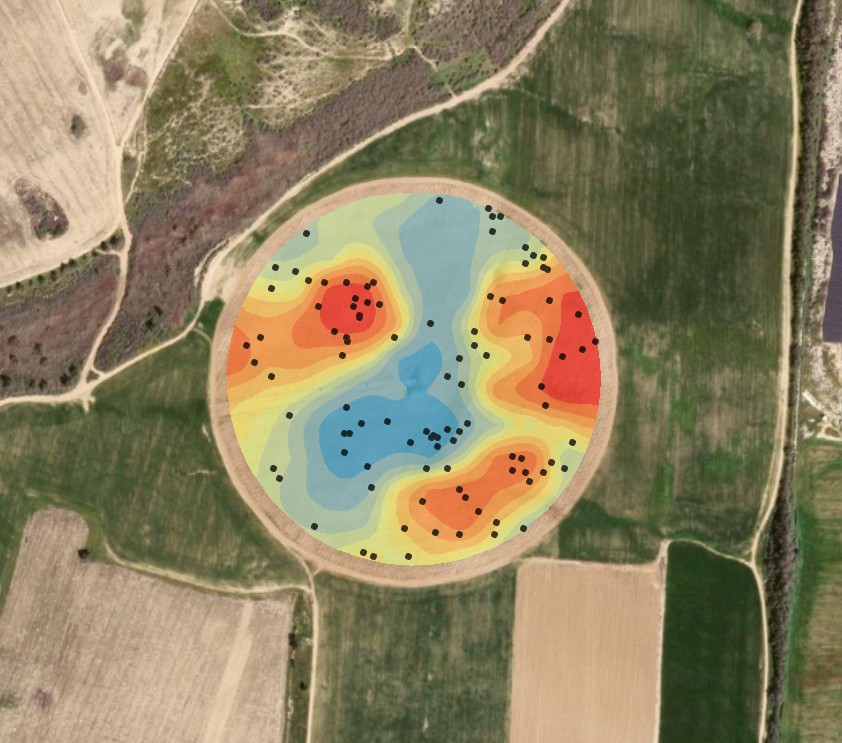
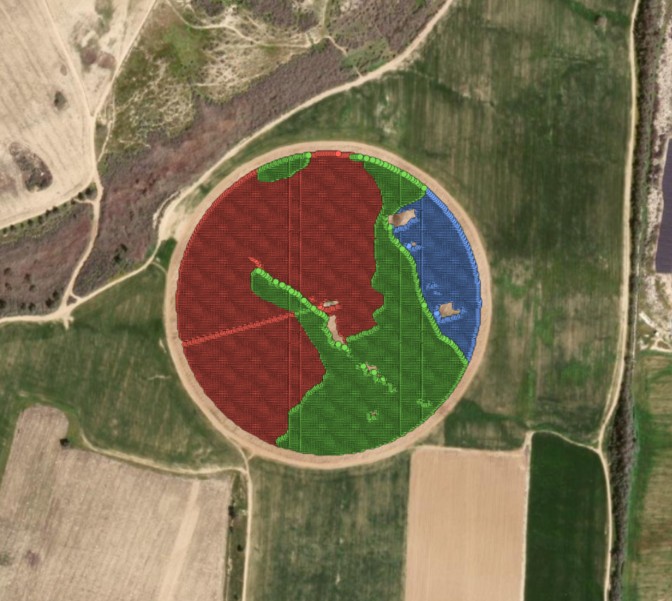
Model outputs included a sampling map with the spatial design (location and distribution) of samples or sensors, including the number of samples required for each sampling design. Outputs included also the partition of the field into Management Zones and the accuracy evaluation of the model for each sampling design.
Conclusions and recommendations
Sample4Crop is a comprehensive spatial sampling model. It provides users with output sampling maps that can support decisions on sampling size and its distribution to better understand the spatial structure of crop or soil water content on a sub-field level. However, accurate and meaningful outputs largely depend on sufficient spatial coverage and on its spatial resolution (pixel size). Users should test the tool’s outputs against real field data or remotely-sensed data before developing management recommendations.


