Introduction
W4Crop is a decision support model to predict the spatial distribution of z-transformed values of crop water status for all input locations. The model is based on the following variables:
Topographical variables: Slope, Aspect and Topographic Wetness Index (TWI), all which can be extracted from a Digital Elevation Model (DEM).
Soil Variables: Electrical Conductivity or Apparent Electrical Conductivity (ECa).
Remotely-sensed variables: Normalized Difference Vegetation Index (NDVI).
Location variables: X and Y Coordinates for each plant (tree or sample point).
Usage Requirements
Input data consists of a csv file and a shapefile with Management Zones (MZ) which is optional.
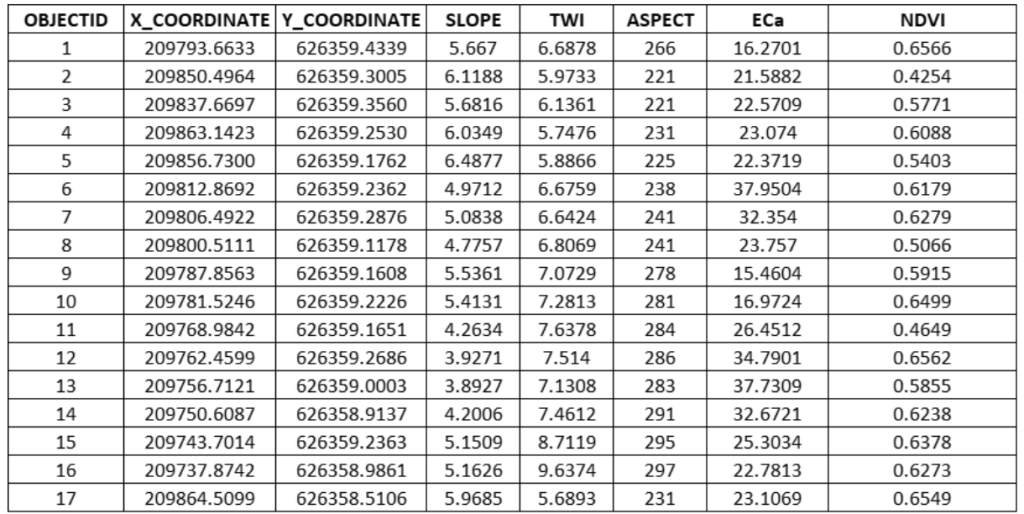
CSV File: Should contain the columns: X-Coordinate, Y-Coordinate in a local projected coordinate system (in meters), Slope (in degrees), Aspect (orientation of slope from due North), TWI, ECa or EC and NDVI values. The following figure provides an example of the required data format.
Each row should represent the values at the tree point or sample point (for crop field data).

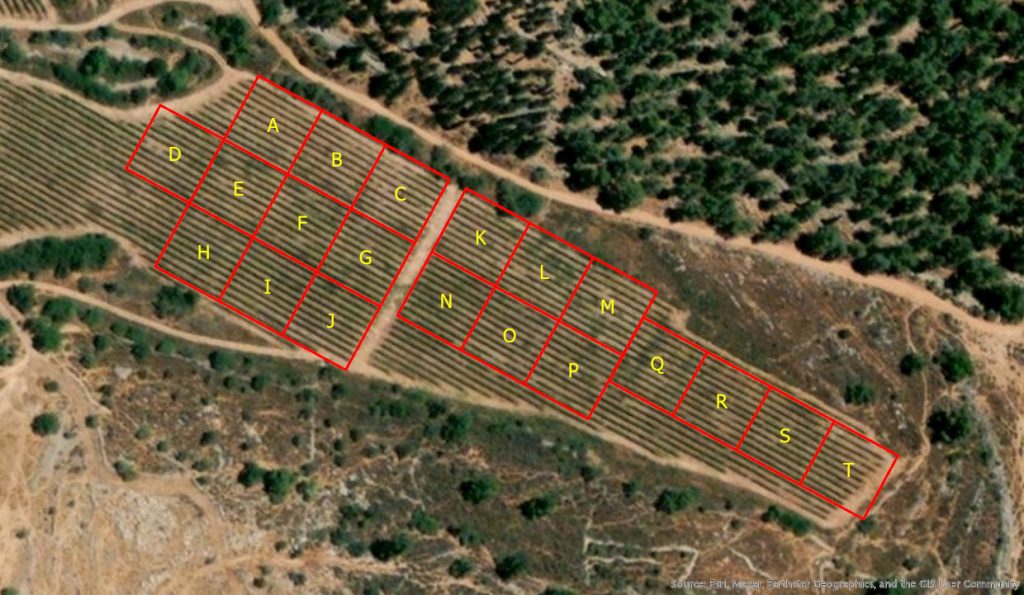
MZ file – Management Zones (MZs) are a common practice in precision agriculture in which the field is partitioned into relatively homogenous sub-field areas based on the clustering of different field characteristics such as soil attributes, plant attributes, yield or environmental attributes such as topography. Clustering is based on the field’s spatial variability. This variability is quantified by using different clustering algorithms and serves as the basis for developing site-specific management zones that will optimize inputs, such as irrigation and fertilization, improve the quantity and quality of yields and support sustainable agricultural practices.
MZ file – Should be in shapefile format (from any GIS system) and zipped in a folder and should contain two columns: the ID number and the MZ number or name. The following figure provides an example of the required data format.


Important Comments
- W4Crop is a highly data-driven model and requires field verification to assess its performance for specific site and crop conditions. The user should test the output accuracy of predictions against field-based collected data or against remotely-sensed based data to assess overall model performance.
- Machine learning algorithms are “data hungry” models and are highly sensitive to the volume of data used. Performance of the model and accordingly accuracy in prediction outputs might be decreased if small datasets are used.
- Spatial resolution of NDVI image should be as high as possible. Low spatial resolution will impair the predictions.
- For the model to predict with high accuracy an NDVI – CWSI correlation must be established otherwise the model will not perform well. To examine this a correlation matrix output is provided.
Tool Output
Outputs from the Water Status Tool include prediction management maps for each input location – either for each tree or for each sample point in the field – as well as for each Management Zone (if Management Zones were added as an input).
Once the tool is run without errors, a zipped folder can be downloaded with all outputs:
- A csv file with the following columns:
ID number, X-Coordinate, Y-Coordinate and the Predicted value (CWSI_Z-Score). This file can be loaded and mapped in a GIS system - A Correlation Matrix figure showing the correlations between all variables.
- A shapefile with the prediction value for each point
- A figure with the prediction value for each point.
If a Management Zones shapefile was added as an input then output will include also:
- A shapefile with the prediction value for each Management Zone
- A figure with the prediction value for each Management Zone
Sample Dataset
This is a sample dataset to understand the format of the required input data. It includes a csv file with point based data for a sample field crop. You can download it, unzip the downloaded folder and then use it for practicing the model with the “Upload File” button under the “Water Status Tool” tab.
Sample4Crop is a decision support model for predicting the number and spatial distribution of samples or sensors in an agricultural field. The model is based on the following variables:
Explanatory Variables:
Topographical variables: Slope, Aspect and Topographic Wetness Index (TWI), all which can be extracted from a Digital Elevation Model (DEM).
Soil Variables: Electrical Conductivity or Apparent Electrical Conductivity (ECa).
Remotely-sensed variables: Normalized Difference Vegetation Index (NDVI).
Location variables: X and Y Coordinates for each sampled location (sample point or tree).
Response Variable:
A response variable representing water content such as Crop Water Stress Index (CWSI), Stem Water Potential (SWP) or Soil Water Content.
Input Data Requirements
Input data consists of a csv file.
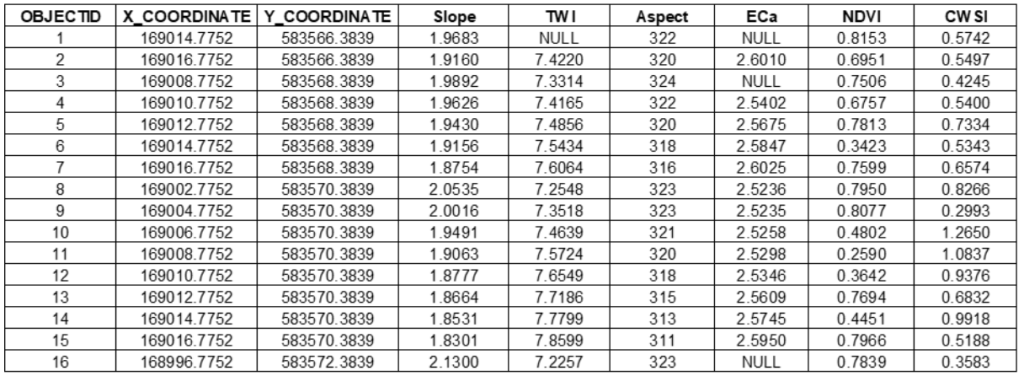
CSV File – Should contain the columns: X-Coordinate, Y-Coordinate in a local projected coordinate system (in meters), Slope (in degrees), Aspect (orientation of slope from due North), TWI, ECa or EC, NDVI and water content values (either CWSI, SWP or soil water content). The following figure provides an example of the required data format.
Each row should represent the values of a sampled location in the field.

Important Comments:
- Sample4Crop is a highly data-driven model and requires field verification to assess its performance for specific site and crop conditions. The user should test the output accuracy of sampling locations against field-based collected data or against remotely-sensed based data to assess overall model performance.
- Machine learning algorithms are “data hungry” models and are highly sensitive to the volume of data used. Performance of the model and accordingly accuracy in sampling might be decreased if small datasets are used.
- Spatial resolution of remotely-sensed images should be as high as possible. Low spatial resolution will impair the performance of the tool.
- For the model to perform with high accuracy a correlation must be established between the explanatory variables and the response variable otherwise the model will not perform well. To examine this a correlation matrix output is provided.
Tool Outputs:
Outputs from the Spatial Sampling Tool include prediction sampling maps for each input agricultural field and partition of each field into management zones.
Once the tool is run without errors, a zipped folder can be downloaded with all outputs:
- A csv file with the following columns:
ID number, X-Coordinate, Y-Coordinate, Sampled value (measured), Sampled value (interpolated). This file can be loaded and mapped in a GIS system. - A Correlation Matrix figure showing the correlations between all variables.
- A shapefile with the location of each sampling point.
- A figure with the location of each sampling point.
- A shapefile of the Management Zones.
- A figure with the Management Zones.
- A graph with the model’s performance (number of samples verses the root mean square error (RMSE)
- A table with number of samples verses the root mean square error (RMSE)
Comment: MZ file – Management Zones (MZs) are a common practice in precision agriculture in which the field is partitioned into relatively homogenous sub-field areas based on the clustering of different field characteristics such as soil attributes, plant attributes, yield or environmental attributes such as topography. Clustering is based on the field’s spatial variability. This variability is quantified by using different clustering algorithms and serves as the basis for developing site-specific management zones.
The practice of dividing a field into MZs is known to optimize inputs, such as irrigation and fertilization, improve the quantity and quality of yields, serve as a basis for stratified-based sampling and support sustainable agricultural practices.
Sample Dataset
This is a sample dataset to understand the format of the required input data. It includes a csv file with point based data for a sample field crop. You can download it, unzip the downloaded folder and then use it for practicing the model with the “Upload File” button under the “Spatial Sampling Tool” tab.
